1. BEST VISUALIZATION
Best Visualization is the process of creating a view according to the data. For e.g if I have a table, the best visualization creates a view.- Select the columns needed

- Click on NEW VIEW and select BEST VISUALIZATION.
- A view will be automatically created for you.

2. RECOMMENDED VISUALIZATION
a) Analyzing trends
b) Comparing values
c) Comparing values and their parts
d) Comparing Explicit value
e) Comparing Percentages
f) Discovering patterns and outliners
For example:

- Here I have created a stacked bar diagram.

3. PERFORMANCE TILE
This view type displays a single aggregate measure value in a manner that is both visually simple and prominent. For Example:

4. BREADCRUMBS
- Breadcrumbs help users to understand the current location within Oracle BI content and the path that they have used to navigate Oracle BI content.
- Breadcrumbs are displayed at the bottom of the page, and users can click a breadcrumb or the breadcrumb overflow button to navigate to a specific location on their breadcrumb trail.

5. ENHANCEMENT TO GRAPHS

- Stacked Graph

- 100% Stacked Graph

6. ACTION LINKS
- Under any selected columns click on column properties.

- An Action link can
- Navigate to BI Content
- Navigate to Web Browser etc.


7. ENHANCEMENT TO DASHBOARD (Create custom layout)
When you create a custom print layout, the dashboard page is exported to BI Publisher and the following items are generated automatically:
- A BI Publisher Report with a layout based on the exported dashboard layout.
- A data model to retrieve data for the dashboard page components.
- BI Publisher Report Editor opens in a new browser window with the auto generated layout displayed as a thumbnail. The report editor allows you to edit or delete the layout, or add a new layout.
NOTE:
- If you delete the data model or the layout manually from the Oracle BI Presentation Catalog, then the associated BI Publisher report will no longer work and the custom print layouts will no longer be available. If you delete an analysis, then the data model and layout will be available but will fail when run.
- As you create custom print layouts, be aware that some customization's and some views may not be supported in BI Publisher. Among some of the items that are not supported are hierarchical columns, performance tiles, map views, trellis views, and dashboard prompts. If an item is not supported, it will be removed from the layout and a message will be displayed as to the reason it is unsupported.
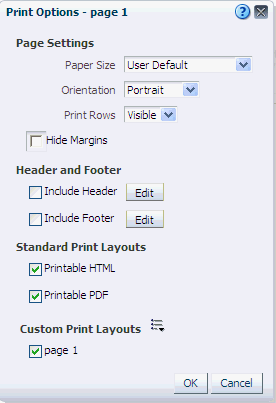
Once you have saved the custom print layouts in BI
Publisher, they are available for that dashboard page and appear in the Custom
Print Layouts area of the as follows:
1. Edit the dashboard that contains the dashboard page for which you want to create a custom print layout.
2. Navigate to the dashboard page.


4. Click the Custom Print Layouts button and select Create Layouts. BI Publisher Report Editor Opens (in a new browser window) with the auto generated layout displayed as a thumbnail.

5. In BI Publisher:
- Edit the layout as desired and save it.
- Create additional layouts, as desired.
- Exit BI Publisher.
7. Select the custom print layouts that you want to make available.
8. Click OK.
9. Save the dashboard.
No comments:
Post a Comment